The latest California housing market data shows fewer home sales across the state as the spring buying season begins. A weekly report from the California Association of REALTORS found declines in both closed and pending transactions for the week ending March 7.
The report tracks daily activity from multiple listing services statewide. It offers a short-term view of supply, demand, and price movement in California housing markets.
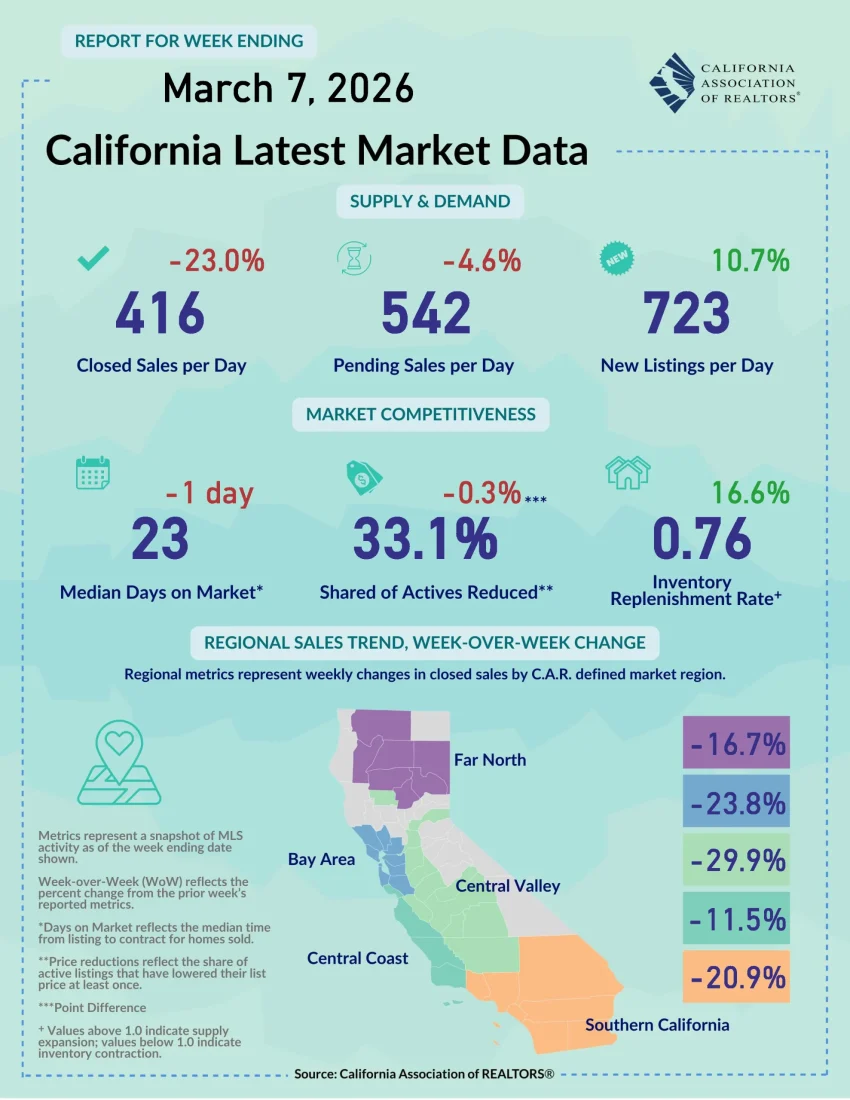
Statewide, closed sales averaged 416 per day during the reporting week. That total represents a 23 percent drop from the previous week. Pending sales averaged 542 per day, down 4.6 percent from the prior period.
At the same time, new listings rose. Sellers added about 723 homes per day to the market, a 10.7 percent increase from the previous week.
Housing analysts often watch these three indicators together. Sales show demand while new listings measure fresh supply entering the market.
Market Data Signals Changing Supply
The California housing market data also showed signs of shifting inventory levels.
The median number of days homes stayed on the market fell slightly to 23 days. That figure dropped by one day from the prior week.
Price reductions remained common across active listings. About 33.1 percent of homes on the market recorded at least one price cut. That share slipped 0.3 percentage points from the week before.
The report also tracks a metric called the inventory replenishment rate. This indicator compares the number of new listings to the number of homes that sold.
The latest data shows a replenishment rate of 0.76. That figure rose 16.6 percent from the previous week. Values below one suggest inventory still shrinks overall, since homes sell faster than sellers add new listings.
Housing economists often use this measure to gauge market balance. Higher ratios indicate growing supply, while lower ratios suggest tighter housing availability.
Data Shows Regional Declines
The report also measured weekly changes in closed sales across major regions of the state.
Every region posted declines in sales activity during the reporting week.
The Central Valley recorded the steepest drop, with closed sales falling 29.9 percent week over week. The Bay Area followed with a 23.8 percent decline.
Southern California, which includes Los Angeles County and the San Gabriel Valley, posted a 20.9 percent decrease in weekly sales. The Far North region fell 16.7 percent, while the Central Coast declined 11.5 percent.
Local housing activity in communities such as El Monte, Baldwin Park, and Rosemead often tracks broader Southern California trends. When regional sales slow, those markets typically experience fewer transactions in the short term.
The weekly report provides only a snapshot of housing conditions. Market activity often shifts quickly as mortgage rates, buyer demand, and seasonal patterns change.
Readers can view the full report at https://www.car.org.
The California housing market data offers a real-time look at supply and demand trends across the state. Local buyers and sellers often watch these weekly indicators as the spring homebuying season develops.